
Census Mapping Projects
 Historical censuses provide rich information to historians but they have not been exploited to their full potential. Massive census volumes burden dusty library shelves in universities across the world. Hundreds of pages of mind-numbing data tables overwhelm researchers. The human brain cannot easily decipher the meaning hidden in row upon row of numbers, but computers do so very well. A GIS database can convert complex census information into visual representations that instantly convey meaning.
 Some of the first and largest HGIS projects were built around historical census data because of their simple compatibility with GIS and their large historical payoff in information. For example, see the Great Britain Historical GIS and the National Historical GIS of the United States.
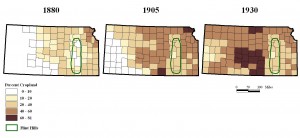
Census data rendered in a GIS can provide a spatial representation of key aspects of the population and economy of a nation, province, or state at a snapshot in time. Termed “thematic maps” by geographers because they illustrate a single theme, such maps can show clustering or distribution of population, age, sex, national origin, literacy, agricultural land use, manufacturing, and hundreds of other basic descriptions of the population in the past. Census data are typically published as aggregate totals for census divisions, such as counties in the U.S. With comparable census data from multiple years it becomes possible to trace spatial changes over time. View an animated census map.
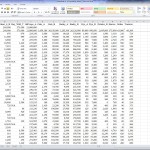
 If you have census data relevant to your research we can help you map them. The process typically begins with data entry to convert published census data from paper into electronic files in a spreadsheet. The second step is to acquire or digitize the boundaries of census divisions. Then, the data and the maps are joined in a GIS, from which it is possible to generate thematic maps representing your data.
The Historical GIS Lab can carry out all of these steps, or only the ones you need. We charge $40 per hour and will design the project to meet your goals.
Get in touch with us to request a price quote.